Share
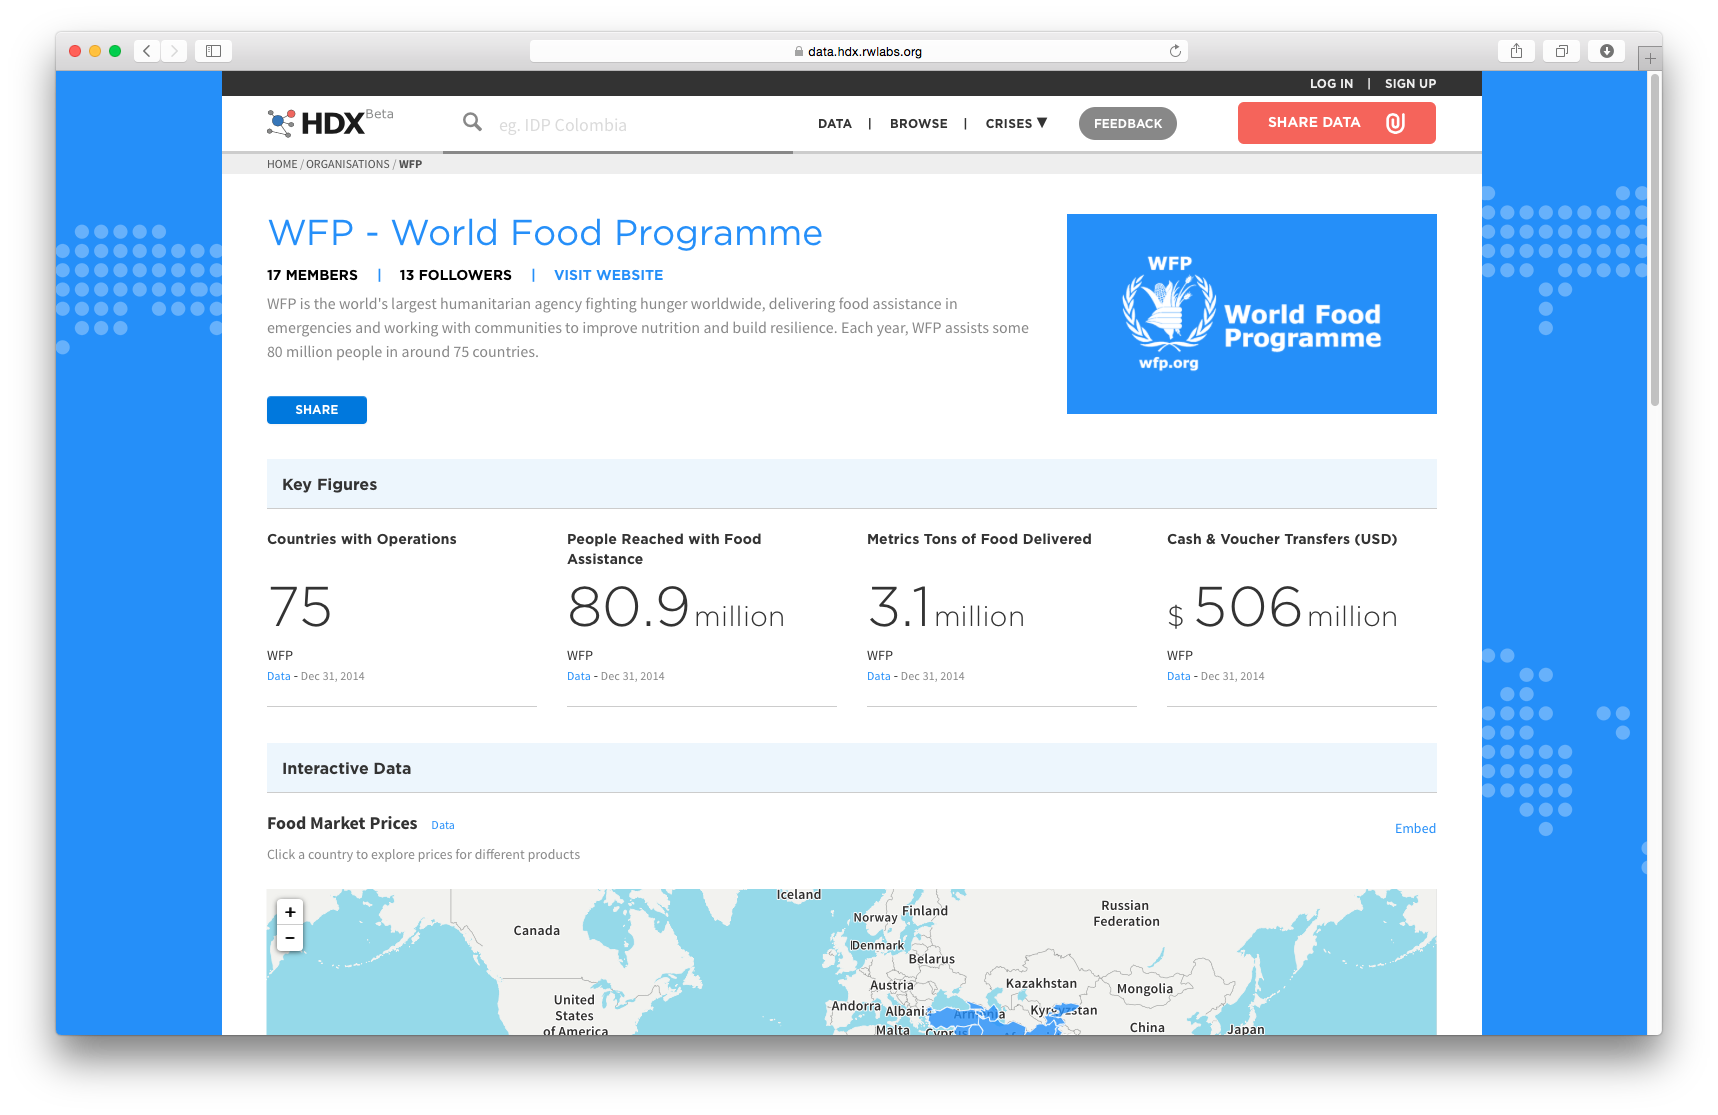
We are excited to release a new custom organization page for our partners at the World Food Programme. The page creates a branded space within HDX for WFP to profile hunger, food security, and nutrition data as well as WFP’s emergency assistance to those in need.
A Closer Look at the Data
WFP datasets shared on HDX include the following:
- The Global Food Prices Database has data on food prices (e.g., beans, rice, fish, and sugar) for 76 countries and some 1,500 markets. The dataset includes around 500,000 records and is updated monthly. The data goes back as far as 1992 for a few countries, although most of the price trends start in 2000-2002.
- The Food Consumption Score (FCS) dataset is based on the FCS indicator, which assigns a food security score based on food consumption and diets. This data is available sub-nationally for 38 countries, such as Nepal and Sierra Leone.
- The Coping Strategy Index dataset measures the severity and frequency of the strategies that households use to cope with acute food insecurity. The strategies vary from borrowing food or money from neighbors to selling household assets. This data is available for 31 countries at a sub-national level.
- The Income Activities dataset includes data on income generation at the household level. Sources of income listed include labor, agriculture, asset sales, and remittances, among others. It is available for 32 countries.
- The Food Assistance dataset contains data on the number of people monthly reached with WFP food assistance in emergency settings. This data currently covers 24 countries and is updated every four weeks (source: OIM-OperationsCentre).
WFP’s country offices compile these datasets through surveys and through cooperation with national government agencies. WFP’s Vulnerability Analysis and Mapping (VAM) unit in Rome consolidates and verifies the data at the global level. WFP’s Operational Information Management unit consolidates and verifies the data at the global level for food assistance datasets.
WFP is the largest humanitarian agency devoted to fighting hunger worldwide, delivering food assistance in emergencies and working with communities to improve nutrition and build resilience. The topline figures for the WFP page provide a quick snapshot of the organization’s work: Annually, WFP assists over 80 million people in 75 countries through the delivery of 3.1 million metric tons of food and US$506 million of cash and voucher transfers.
How We Built It
The HDX team and WFP first began discussing a custom organization page during the height of the Ebola crisis in 2014, when WFP released food market price data for the affected countries in West Africa.
At the time, WFP’s data was available only by manual download from the VAM site. With support from the UK’s Department for International Development (DFID) and the Bill & Melinda Gates Foundation, WFP has now developed an API to make its data available dynamically, making it easier to integrate into other applications, including HDX.
Working with one of our user interface developers, Simon Johnson, we built an interactive visualization for the food prices data that is both beautiful and practical. Users can select a country and see the price trend line for all commodities, and then drill down interactively to further explore a specific commodity over time and within sub-national geographies.
This interactive food prices visualization is embeddable, so that others can add it to their own web pages. WFP has made it available on the WFP VAM Shop. To visualize the country data, please click on the “Price by Commodity” indicator data.
For more information about the WFP’s API, visit: http://reporting.vam.wfp.org/api/
More information on WFP’s operations and response in emergencies can be found at www.wfp.org/operations. Monthly updates on food assistance in emergencies, consolidated in the WFP Operations Centre, are available directly at the new WFP Organization page on HDX.
Making HDX a Home for our Data Partners
We would like to support all organizations in HDX with their own branded spaces. We have developed two other examples: one for our partners at the Somalia NGO Consortium and one for OCHA Nepal, both of which include an interactive visual for data on who is doing what where (3W).
If your organization would like a custom page, send us an email at hdx@un.org. We are happy to schedule building one for you. Just remember that we need good data that is maintained over time and we can take it from here.
