Share
Climate shocks such as droughts, heatwaves and floods are a major driver of disasters. Humanitarians increasingly need to incorporate climate risks and impacts into their analysis and planning. As part of the Centre’s work to improve access to climate data, we collaborated with the World Food Programme (WFP) to bring over 100 climate-related datasets covering 32 countries onto HDX.
Climate data describes the weather patterns (e.g., temperature or precipitation) in a particular location and their impact on the ground (e.g., on vegetation health or water availability). Although this data is typically available through meteorological and climate services, humanitarians often face hurdles in accessing and processing it. We worked with the Climate and Earth Observation Unit of the Research, Assessment and Monitoring division of WFP (RAM-C) to make this data easier to find and use. RAM-C leverages state-of-the-art geospatial technology combined with scalable computing resources into their Humanitarian Data Cube, a cloud-native platform that processes raster-based earth observation and climate data at scale for WFP operations and the wider humanitarian community.
The RAM-C team downloads the input data, typically available as raster data, directly from its providers such as the Climate Hazards Group InfraRed Precipitation with Station data (CHIRPS, provided by the University of California Santa Barbara’s Climate Hazards Centre and United States Geological Society) or Moderate Resolution Imaging Spectroradiometer (MODIS, provided by the United States National Aeronautics and Space Administration.) RAM-C then processes the data and aggregates it to generate metrics per administrative region that can be easily analysed and interpreted by humanitarians. For this collaboration with the Centre, RAM-C prepares datasets and publishes them on HDX as tabular data, and regularly updates them to provide both the latest and historical climate data.
Our collaboration with WFP has so far focused on rainfall, temperature and vegetation health datasets covering 32 countries with a humanitarian response plan or an anticipatory action framework.
The data contains multiple indicators and metrics. For instance, these variables are generated for precipitation:
- total rainfall (daily and aggregated over 5 days, 1 month, 9 months, 12 months)
- long-term average over 20 years
- deviations from long-term average, including Standardized Precipitation Index (SPI)
- number of dry/wet days
- rain intensity
- occurrence and duration of dry/wet spells
The data is provided in a CSV format so humanitarians can analyse it regardless of GIS or coding expertise. It is aggregated at the second subnational administrative division (admin2) with standard p-codes based on the Common Operational Datasets. The datasets provide between 20 and 40 years of history (depending on the indicator), and are updated every 14 days. Over 60 datasets on precipitation and Normalized Difference Vegetation Index (NDVI) are already available on HDX. Over the coming months, more data on precipitation patterns, Standard Precipitation Index (SPI), Potential Evapotranspiration (ET0), and Land Surface Temperature (LST) will be added.
With this data, humanitarians can assess current drought conditions or analyze historical trends to anticipate the impact of rainy seasons. It is also possible to rank subnational areas by the amount of rainfall or compare current conditions to previous years to determine the severity of a shock, among other applications.
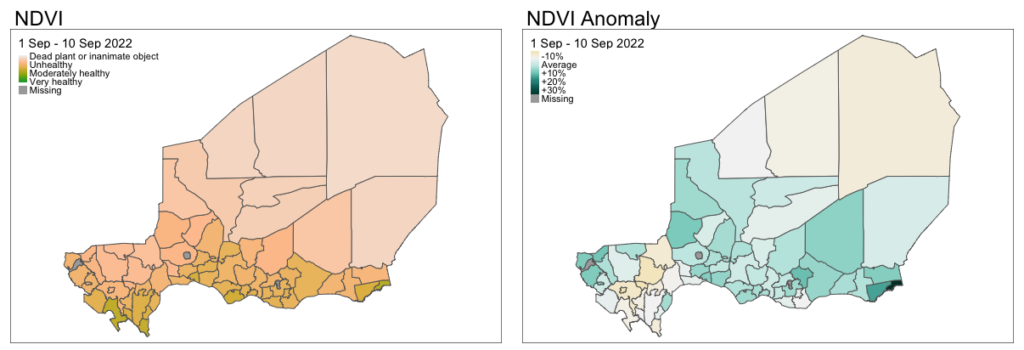
For example, the values from NDVI are most commonly used in agriculture to monitor crop health. The maps below present NDVI data from the first 10 days of September 2022 in Niger. On the left, NDVI values indicate that moderately healthy vegetation (in brown-green) can be found only in the southern part of Niger. On the right, anomaly data shows that only a subset of adm2 regions had vegetation that were abnormally unhealthy (in beige) while other regions had healthier-than-normal vegetation (in green). Each map tells part of the story, where it can be seen that there was limited green vegetation (left), but that in many areas its density was nonetheless above historical average (right).
These maps were generated from the tabular data now available on HDX using R but could have been created using client geographic information system software such as ArcGIS or QGIS. The datasets on HDX remove significant barriers and extra processing work such as: using programming to download multiple datasets for both the index and anomaly values, or to cover the time period of interest; validating a processing or analytical methodology that is scientifically sound; processing a large raw dataset (by filtering for atmospheric noise, filling gaps, or converting timescales); using shapefiles to define geographical areas that aligned with administrative regions; navigating the analytical complexity involved in computing statistics per zone or time period; and matching statistics to geographical areas to map them. In short, the preprocessed dataset saved analytical time, ensured the technical soundness of the analysis, and required no more than knowing how to use a spreadsheet to pinpoint the worst affected adm2 regions.
The WFP-contributed datasets complement other climate-related data that is available on HDX. In 2022, the HDX Data Grids were expanded to include a new sub-category for climate impact data. This data contains the current and historical impacts of climate events relating to floods, droughts and storms, as well as their location, date and impact on affected populations, infrastructure and/or vegetation. As of April 2023, climate impact datasets have been added for 18 locations with humanitarian operations. Despite this progress, data remains scarce for certain types of climate shocks and locations, and the historical time period is often limited to a few years.
The Centre will continue to work with partners to fill data gaps and build capacity within the humanitarian sector for using climate data. We appreciate the support from WFP in making this data available through HDX.