Share
In June 2018, IOM’s Kashif Nadeem wrote a blog introducing a collaboration to make displacement data available through the Humanitarian Data Exchange (HDX). IOM has added more than one hundred Displacement Tracking Matrix (DTM) datasets to HDX, covering 30 countries. Half of these datasets include Humanitarian Exchange Language (HXL) hashtags, which enable faster data processing.
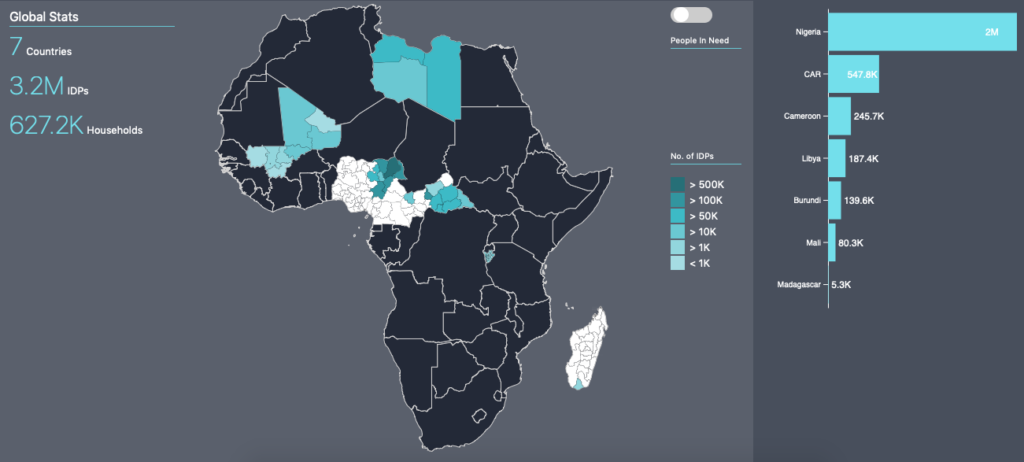
Now a new IOM Displacement Tracking Matrix dashboard provides a closer look at internal displacement in seven African countries. Powered by the HXL standard and related tools, the dashboard is updated whenever DTM country teams upload new files to HDX. The dashboard also includes data on the number of people in need in the same locations, derived from the 2018 Humanitarian Needs Overview datasets on HDX.
Created using IOM displacement data, the interactive IOM DTM dashboard is updated live as new data is shared on HDX.
IOM’s Displacement Tracking Matrix
One of IOM’s most important data initiatives is the Displacement Tracking Matrix, which monitors displacement and population mobility, provides critical information to responders during crises, and contributes to a better understanding of population flows.
Country teams collect DTM data at various stages of a humanitarian response — most commonly during the emergency phase — to inform assistance to displaced people. Assessments from different crises often have different questions, written in different languages, making it difficult to compare data across countries.
Proving the Value of HDX and HXL
We explored a number of areas where we could work with IOM to add value to the DTM data on HDX. This included using HXL to create interoperability between DTM datasets and other sources, and using HDX to increase access of the data and visualizations to a broader audience. The DTM dashboard serves as a proof of concept to test both of these services.
We started with the ‘baseline assessment’ datasets from seven countries with active DTM teams: Burundi, Cameroon, the Central African Republic, Libya, Madagascar, Mali, and Nigeria. All of this data was already available on HDX with HXL hashtags, so no data preparation was required.
We focused on two indicators: 1) the total number of internally displaced people (IDPs) surveyed, and 2) the total number of IDP households surveyed, along with metadata specifying location and date. We used a behind-the-scenes HDX tool called the HXL Proxy to merge the datasets from the seven countries into a single combined dataset. This dataset is automatically updated as IOM field staff upload new DTM assessments to HDX — no human intervention is required.
How HXL works
Adding a row of HXL hashtags to a spreadsheet greatly simplifies interoperability. For example, #country+name always identifies a column containing country names, #adm1+name always identifies a column containing top-level geopolitical subdivision names, and #affected+idps+ind always identifies a column containing the number of individual IDPs. Because the hashtags are standardized, differences in column ordering (or even the number of columns) no longer pose a problem.
Below is an example of three columns, with HXL hashtags, from the seven DTM datasets visualized in the dashboard.
| Country | Top-Level Geopolitical Subdivision | Number of IDPs |
| (HXL hashtag) | #adm1 +name | #affected +idps +ind |
| Burundi | Admin1 | Nombre de PDI |
| Cameroon | Adm1 | idp_ind |
| Central African Republic | ADM1_NAME | IDP_ind |
| Libya | ADM 1 Geodivision (EN) | IDPs in Baladiya (IND) |
| Madagascar | Admin 1 | Total No# of IDPs Ind# |
| Mali | Admin 1 | Total No. of IDPs Ind. |
| Nigeria | State of Displacement | Number of IDP |
We use the HXL Proxy to merge the data and present it through the dashboard with on-demand updates. Processing web-based data on the fly with a dynamic tool like the HXL Proxy has both advantages and disadvantages compared to the more traditional approach of importing data periodically into a relational database. Many organizations may choose to use both approaches (as IOM does):
| Importing into a Database | Merging Data Dynamically Online |
|
|
Next Steps
With the initial success of this proof of concept, we plan to continue by adding data from more countries and sources. Next steps might include:
- Adding more indicators from the DTM data to the dashboard
- Incorporating the DTM ‘site assessment’ datasets and adding more countries to the analysis
- Combining data from other sources and adding this to the dashboard to provide more insight and context
If you are using HXL hashtags in your data, get in touch so that we can help you to bring it together with other sources. If you use DTM data in your work, we’d love to learn more about how you are using it. Send an email to hdx@un.org.
