Tags:
Summary:
Data about the population of a country is an essential starting point for humanitarians to understand exactly who needs what type of assistance and where. But that information is often hard to come by in many crisis-affected countries. Seventy-five per cent of countries with a UN inter-agency humanitarian response plan have not had a national census in over a decade.
OCHA’s Humanitarian Data Exchange (HDX) platform has partnered with the technology company Meta since 2018 to improve access to up-to-date population data. The initiative enabled the World Health Organization (WHO) and World Vision to successfully identify and reach people in need of assistance.
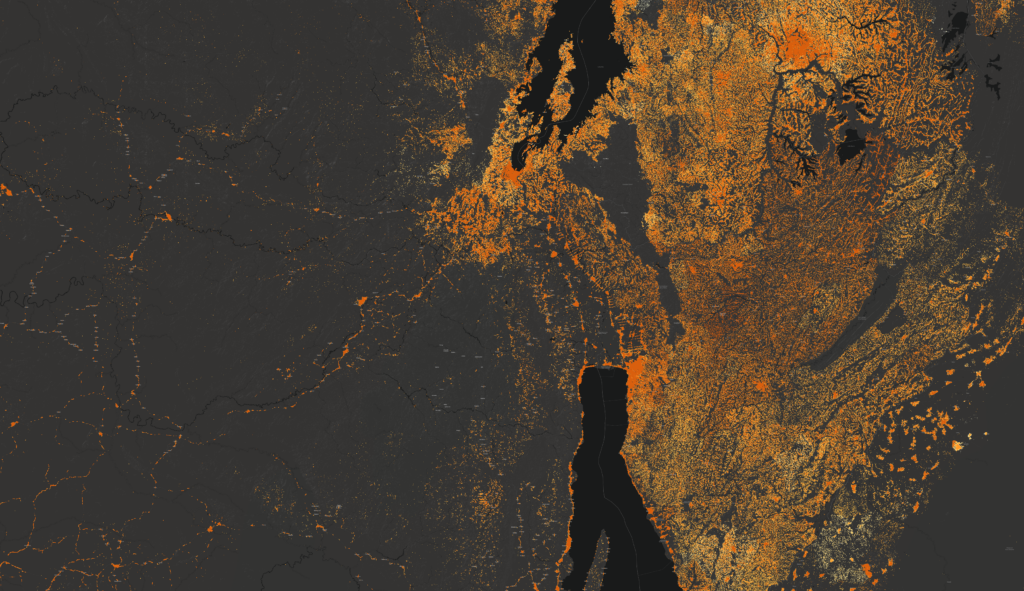
Meta’s High-Resolution Population Density Maps (referred to hereafter as ‘population density maps’), powered by artificial intelligence (AI) and satellite imagery, estimates the number of people living within a 30-metre grid and their demographics. This can include estimates for the number of children under age 5 and the number of women of reproductive age.
WHO and World Vision faced a challenge: locating the communities that needed support. Meta had a solution: timely demographic data in unprecedented detail. HDX bridged the gap between challenge and solution by providing a platform for easy access to humanitarian data.
In 2018, WHO used Meta’s population density maps to reach 5,000 children in the Democratic Republic of the Congo (DRC) with its first dose of the polio vaccine, and since 2020, World Vision has reached people with clean water in dozens of locations worldwide.
Challenge:
At least 90 per cent of children in a country need to be fully vaccinated against polio to prevent it from spreading.
DRC’s immunization level remains below 90 per cent, leaving many children vulnerable to recurrent outbreaks. In 2018, eleven polio cases were detected in north-west DRC’s Mongala Province. Despite WHO’s vaccination campaigns, the virus continued to circulate. Cisse Aboubakar, WHO Geographic Information System Specialist, was asked to investigate. He explained: “To understand why the virus kept circulating, we had to know if they were reaching all the children with the polio vaccine but how can we be sure we are vaccinating all the children if we don’t know how many there are and where they are.”
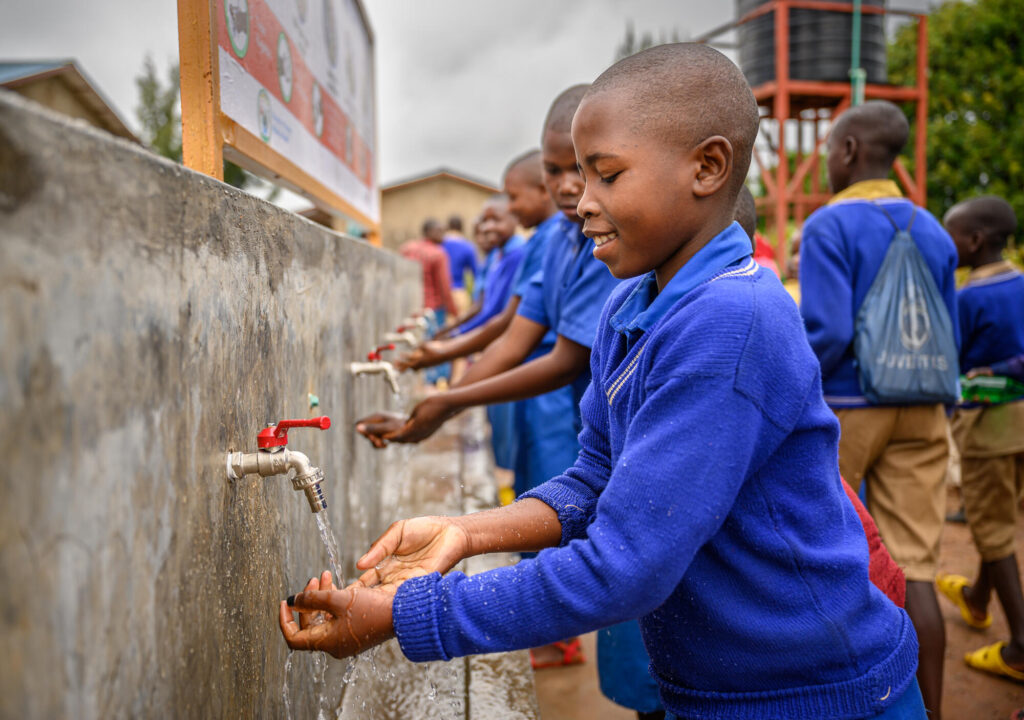
World Vision had a similar problem. Its goal is to accelerate universal and equitable access to water, sanitation and hygiene services in more than 40 countries. Through the data platform mWater, World Vision can map and visualize the location of water supply services. But to plan where to install new water systems, World Vision needed a granular understanding of where people lived.
These types of problems were exactly what Meta’s Data for Good team set out to solve.
Outcome:
Data for Good partnered with the HDX team to make its population density maps open and publicly available through the platform. HDX worked with Data for Good to ensure metadata was available for the maps so that humanitarians could be confident in the data set’s methodology and quality.
When WHO began investigating where to target its polio vaccination campaign, it reached out to HDX for data to understand Mongala’s population. After being informed about Meta’s population density maps, Aboubakar made a startling discovery: “When I looked at the satellite imagery, there appeared to be 100 villages under dense rainforest that we had not previously known about.”
Aboubakar travelled to the villages and discovered no children had ever been vaccinated.
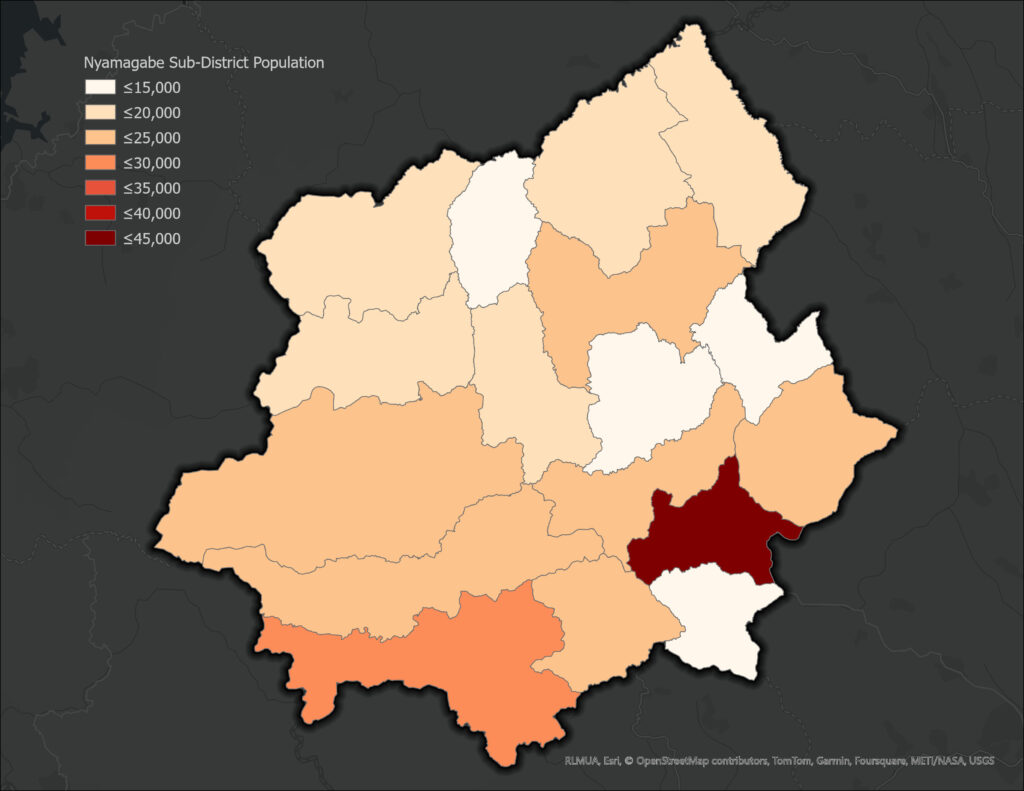
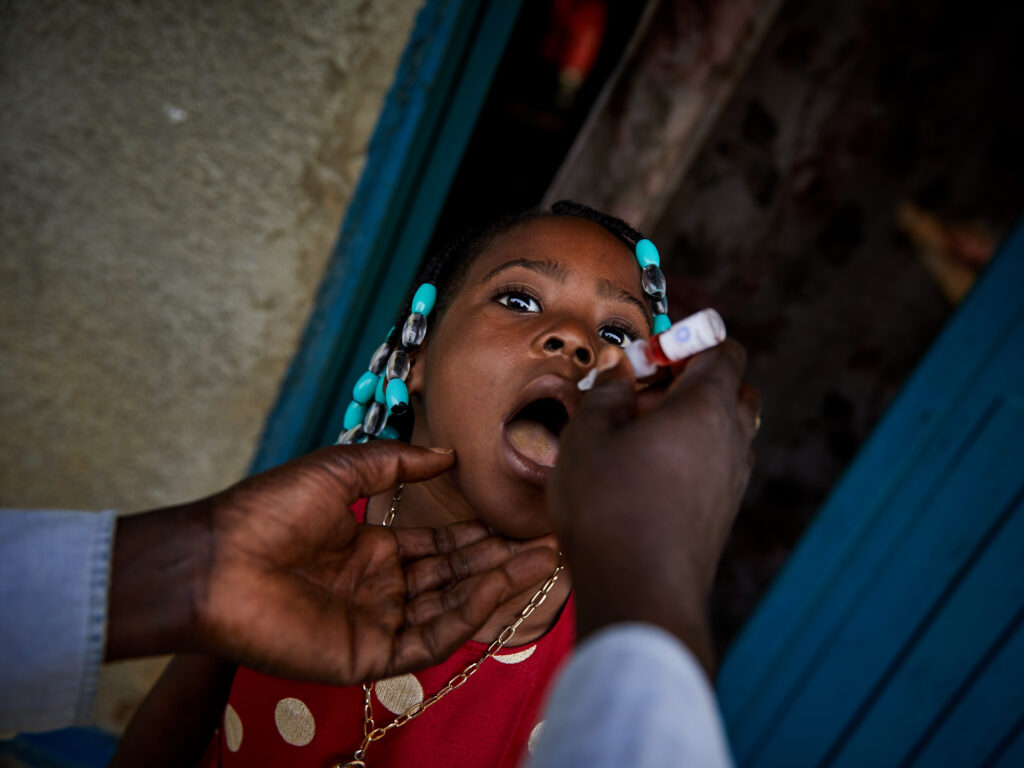
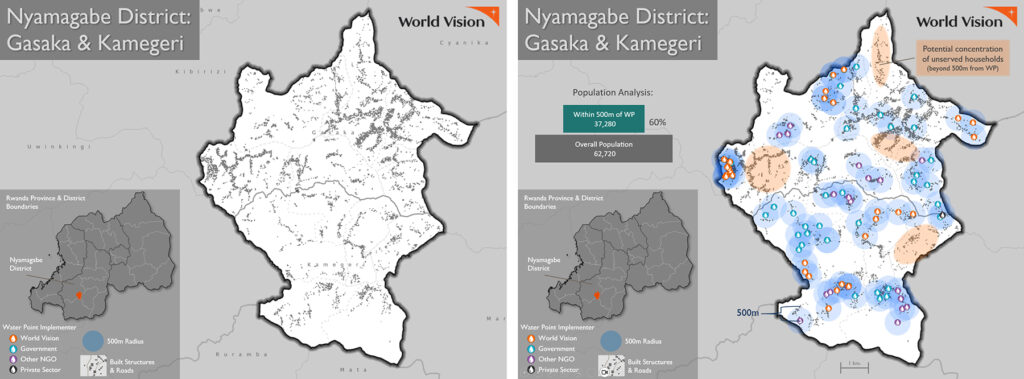
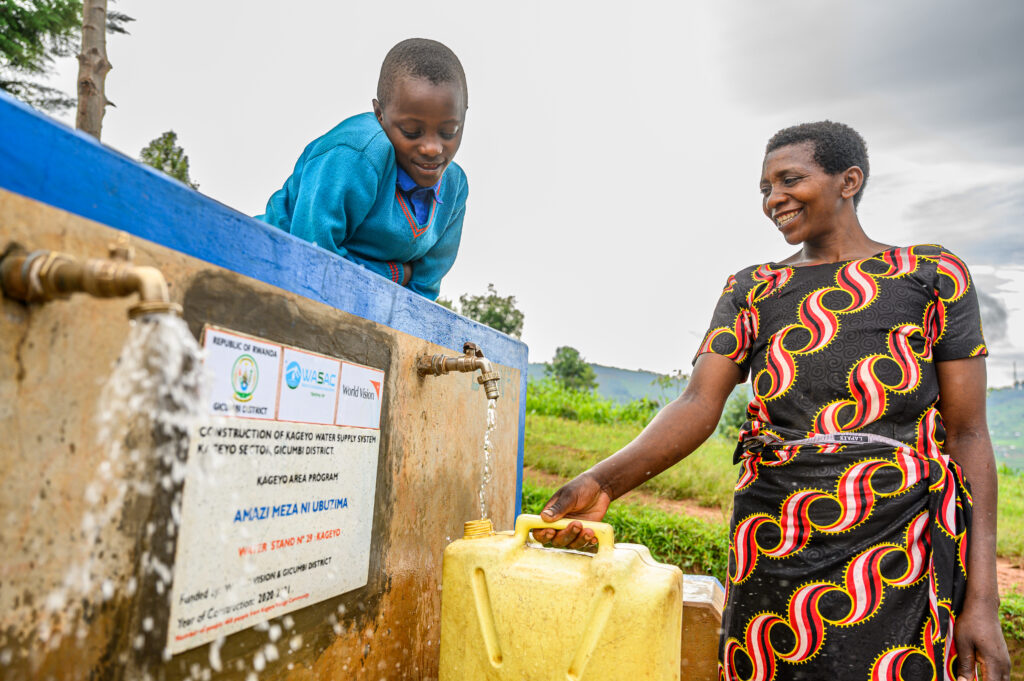
Following the discovery, WHO vaccinated 5,000 children across the 100 villages with its inaugural dose of the polio vaccine. The virus stopped circulating in Mongala, with no new cases reported for more than a year. Similar to WHO, World Vision used Meta’s population density maps to target its response. By layering the maps with the water point data from mWater, World Vision could assess water coverage levels and see where people were living compared to where the water sources were. This type of analysis helped World Vision to identify potentially unserved areas, plan investments and demonstrate universal water service coverage in areas where it operates. In 2023, the maps helped World Vision to complete a major milestone in Rwanda, supporting universal coverage to basic water service in 39 subdistricts, benefiting more than 1 million people.
Conclusion:
There is an increasing appetite in the humanitarian community to understand and use non-traditional data sources, such as those derived from satellite imagery, but this can also be overwhelming.
The HDX team was a trusted broker for both WHO and World Vision, and a launch pad for their analysis.
HDX connects people and organizations in the humanitarian community to a wide range of data sources. Its commitment to data quality and transparency means partners can view and understand the metadata and methodology before deciding to use the data.
Now in its tenth year of operations, HDX will continue to be an intermediary between data providers and data users. OCHA’s Centre for Humanitarian Data is working on guidance to support humanitarians to assess non-traditional data sources and learn how they can be integrated into humanitarian planning and analysis.
To learn more:
Read the full story: OCHA and META: Partnering to Give Humanitarians Open Access to Population Data.
Find more information on how World Vision used the high-resolution population density maps at The Geography of Clean Water for All and A promise verified.
Download Meta’s High-Resolution Population Density Maps for 192 countries on HDX. Note, as of 2024, Meta’s population density maps are no longer being actively updated. The University of Southampton’s WorldPop team will soon offer new annual population data sets that will cover the 2015-2030 period, and will use Meta’s training data for updates and refinements to this work. See WorldPop gridded population current data sets for 240 countries and territories on HDX.
We’re always looking for great stories on how HDX is impacting humanitarian response and decision making. If you have one to share send us an email at kate.katch@un.org.
