Share
The Centre has developed the first in a series of ‘Learning Bytes’: short online training sessions to help humanitarians build data skills on a specific topic. We have designed these knowing that everyone is busy and in-person training will not be possible for some time. We know this community is eager to learn about data and we hope this material can help.
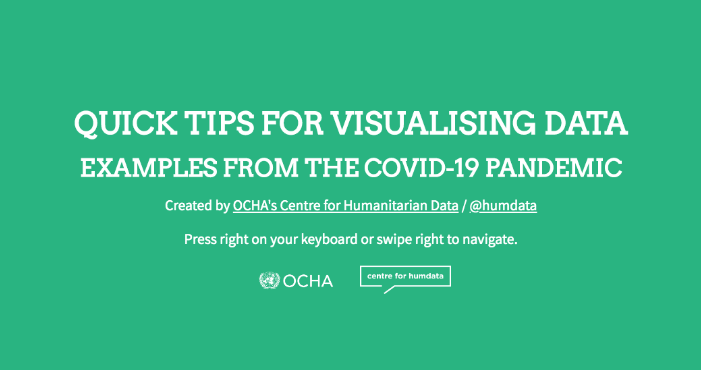
Our first session is on ‘Quick Tips for Visualising Data’ with examples from the COVID-19 pandemic. The choices we make when we visualise data influence how people see, understand, and react to the underlying data.
The session includes four learning components: 1) why we visualise data; 2) understand the data; 3) choose the right visualisation; and 4) designing thoughtfully. This is followed by an opportunity to make your own visual with step-by-step instructions. The session ends with a short quiz to test your knowledge.
The expected length of time to complete all segments is 25 minutes. All learning components are downloadable for offline learning. Give it a try and let us know what you think!
Over the next few months, we will be releasing additional Learning Bytes to help improve data literacy in the humanitarian sector. If you have suggestions for what we should develop next, send ideas to centrehumdata@un.org.
